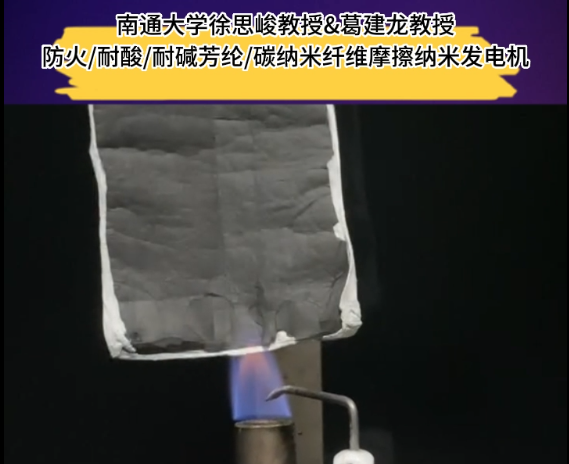
LnMOF@PVA nanofiber: energy transfer and multicolor light-emitting devices
2019/11/27 21:38:15
admin
In this paper, we report the use of electrospinning methods for the preparation of polymeric nanofibers containing Lanthanide-Organic Frameworks (LnMOFs) and present a detailed investigation of their spectroscopic properties. The nanocomposites were based in polyvinyl alcohol (PVA) and two isotypical 2D LnMOFs ([Ln(DPA)(HDPA)], where H(2)DPA is pyridine 2,6-dicarboxylic acid and Ln = Tb3+ and Eu3+ ions, which we have designated as EuMOF@PVA and TbMOF@PVA, respectively. Additionally, we prepared three tunable visible light-emitting devices based on nanofibers containing different [Tb(DPA)(HDPA)]/[Eu(DPA)(HDPA)] relative concentrations (95-5 wt%, 80-20 wt% and 50-50 wt%, designated as Tb0.95Eu0.05MOF@PVA, Tb0.8Eu0.2MOF@PVA, and Tb0.5Eu0.5MOF@PVA, respectively), and investigated the energy transfer among the optical centers. The emission spectrum of EuMOF@PVA presents typical narrow bands of the Eu3+ D-5(0) -> F-7(J) transitions centered in a non-centrosymmetric site, and its profile indicates that in EuMOF@PVA the point group of the Eu3+ ion is distorted from the local C-1 symmetry observed in as-prepared material. Horrocks' rule applied to EuMOF@PVA leads to n(w) = 0.40, in an indication that the encapsulation of LnMOF materials in PVA does not necessarily imply the coordination of water molecules in the inner-sphere of the lanthanide ion; thus, the distortion of the symmetry around of metal center can be solely associated to the steric effect of the PVA chains. The D-5(4) -> F-7(5) transition centered at ca. 543 nm is the strongest in the emission spectrum of TbMOF@PVA, corresponding to ca. 52% of the integrated emission spectrum. The emission spectra of Tb0.95Eu0.05MOF@PVA, Tb0.8Eu0.2MOF@PVA, and Tb0.5Eu0.5MOF@PVA show lines typical of the Eu3+ and Tb3+ ions. The colors emitted by Tb0.95Eu0.05MOF@PVA, Tb0.8Eu0.2MOF@PVA and Tb0.5Eu0.5MOF@PVA are in the green-yellow (0.4083, 0.4803), yellow (0.4364, 0.4616) and orange (0.5042, 0.4212) portions of the chromaticity chart, respectively. The Tb3+ -> Eu3+ < W-ET > and < n(ET)> do not vary with the increasing of the acceptor (Eu3+) concentration, since the donor-acceptor interaction strength is a function of distance.

0

网友评论
请遵循相关法律法规,理性发言
查看更多回复